


US Immigration, in numbers
The Census Bureau indicates that residents from outside the U.S. exceeded 46 million (50% of them Hispanic) in 2022, more than California has inhabitants. Fifty-three percent have already obtained citizenship.

(USCIS)

The percentage of immigrants in the country reached a new record in 2022, when more than 46 million foreign-born people were registered in the United States, more the population of California, the most populous state with almost 40 million. That represents 13.9% of the total number of residents in the country. In The Golden State, that figure exceeds 25%. Hispanics are the main demographic group, comprising 50.3% of all U.S. immigrants, and Mexicans, who account for more than 10 million, are the largest nationality. In an election year, it is notable that 53% of these immigrants obtained citizenship, so almost 25 million people born outside the United States will be able to vote in November.
These figures fuel the debate about whether the Democrats' strategy of opening the borders seeks to increase the number of voters for their party. According to Census Bureau data, 53.1% of the more than 46 million people not born in the U.S. had U.S. nationality by 2022. That is to say that at least 24.5 million immigrants could vote in the November presidential election. Between 2010 and 2022, more than 7 million immigrants were naturalized.
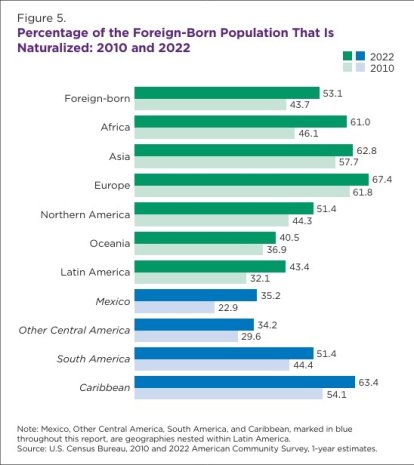
Percentage of nationalized foreigners in the USA 2022.
Hispanics: The largest group
Between 2010 and 2022, the number of immigrants residing in the country grew by 15.6%, according to the report The Foreign-Born Population in the United States: 2022, published by the Census Bureau. In 2010, the number of people not born in the U.S. was 39,960,000 (12.9% of the total population), which rose to 46,180,000 in 2022.
By place of birth, South America is the geographical area with the greatest presence, with 23,230,000 immigrants from there, which represents 50.3% of the total number residing in the U.S. Among Hispanics, Mexico, despite having its population reduced by 1 million people, is still the place of birth for more than 10 million people who live within U.S. borders, 23.1% of the total.
After Latin America appears Asia, which is the group with the greatest growth in number of people in the 12 years studied. In this time, Asians in the country increased by more than 3 million, reaching 14,350,000, 31.1% of the immigrant population. They are followed by those from Europe (4,729,000), Africa (2,753,000), North America (829,000) and Oceania (289,000).
26.7% of Californian residents are immigrants
The percentage of immigrants is even higher in certain states. In California, for example, the foreign-born population stands at 26.7%, although the percentage decreased slightly compared to 2010. Furthermore, in New Jersey (23.2%), New York (22.6%) and Florida (21.1%), immigrants exceed 20% of the total state population.
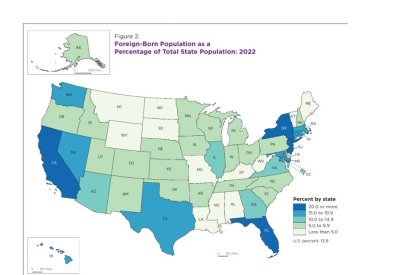
Map of the percentage of population not born in the US.
More than 20 million immigrants between California, Texas and Florida
Regarding the number of immigrants by state, California once again leads the ranking with 10,430,000 foreign-born residents. It should be noted that The Golden State's immigrant population exceeds the sum of the next two on the list, Texas (5,169,000) and Florida (4,817,000). New York (4,460,000) also has more than 4 million residents born outside the U.S.
LATEST