


Black homicide rate surpasses 1990s levels
Additionally, a study shows over 85% of all firearm-related deaths since 1990 were men. The white population had the highest rate of suicide.

Chicago, 18 de agosto de 2018 / Cordon Press.

The American Medical Association published a report on deaths caused by firearms since 1990, and the results are disturbing. In this 32-year period, firearms resulted in more than 1.1 million deaths in the United States. According to the study, the incidence of firearm deaths gradually decreased through the turn of the millennium until reaching a minimum in 2004, though it has since increased by 45.5%.
Firearm-related deaths have reached a 28-year high. This trend has gone hand in hand with the increase in crime in the country. It is worth noting that the American Medical Association report is not based on a sample, but on a the total deaths that occurred in the entire population during this time.
More than 85% of deaths are men
One of the study's more remarkable conclusions is that 85.8% of the 1,110,421 people killed with firearms in this time were men, a total of 952,984. The remaining 157,165 were women. Further:
This numbers clearly illustrate some of America's problems with gun violence. For easier understanding of the data, the authors of the report created graphs showing the concentration of homicides and suicides by both age and year.
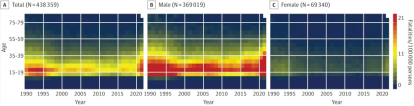
Homicide: back to the 90s
The first graph below shows the incidence of homicide in the total population, and the two to the right show those of the male and female populations. In the total population, the incidence of homicides was highest in the 1990s, especially in the first half of the decade, then decreased steadily. In the last few years, however, the rate increased again. The graphs also show that the murder rate is consistently highest among young people.
Finally, there are significantly more male than female homicide victims. In the graph for men, there is a large red split between 18 and 38 years that waxes and wanes slightly over time. In the case of women, there are only faint blots of yellow at the beginning and end of the timeframe.
More black homicides than in the 1990s
The study also sorts the data by race (or ethnicity in the case of Hispanics). The first notable bit of data is that the incidence of homicide is low in the white population but higher among Hispanics and blacks. The case of Hispanics is interesting: in the 1990s they were the victims of a wave of homicides, but it has mostly declined over time. Although it has increased in recent years and especially in 2021, it is a far cry from the high murder rates of the 1990s.
This is not the case for the black population. One of the study's main conclusions is that the incidence of homicides among the black population is higher today than in the 1990s.

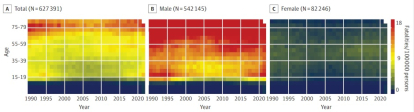
Suicides
As for suicide, it is noted that the female chart is mostly blue with faint streaks of yellow. In the case of men, however, the graph is mostly red above 19 years of age. Just as with the homicide rate, the early-to-mid-2000s saw a decreased incidence of suicide.
One difference between suicide and homicide trends is the age pattern. Homicide victims are mostly in the of 18-38 age range, but those who commit suicide tend to be a bit older. For men, most suicides happen after the age of 60, whereas suicides for women are most common in middle age.
Separating suicide patterns by race or ethnicity also shows a different pattern than homicides. Proportionally, white people are much more likely to take their own lives than black or Hispanic people.

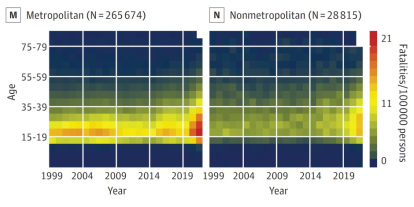
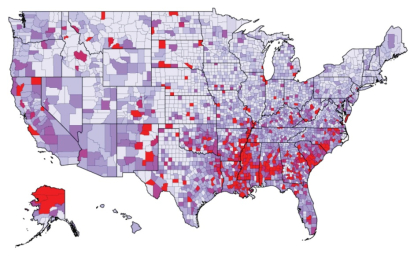
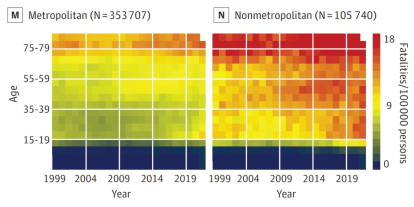
Geographical analysis
Another curious piece of data is that there has been a sharp increase in the number of homicides in metropolitan areas for young people. The incidence is higher now than at any time in the past 32 years.
If we look at homicide incidence by county, the highest concentrations are seen in those with a high black population, especially in the south. However, there are also red counties in Alaska, among other areas.
For suicides, there are far more cases in nonmetropolitan areas.
Sorting by county, the distribution of suicides is more homogeneous, though there is a higher concentration in the middle of the country. It is highest in states such as Alaska and Nevada.

LATEST