





ANALYSIS
Greener doesn't always mean more water: Global greening weakens link between carbon and moisture
The planet has become greener since the 1980s, but that does not guarantee more available water. A global study finds that, in nearly half of the areas analyzed, increased greenness coincided with lower moisture levels, and that the link between carbon sequestration and water conservation has weakened.
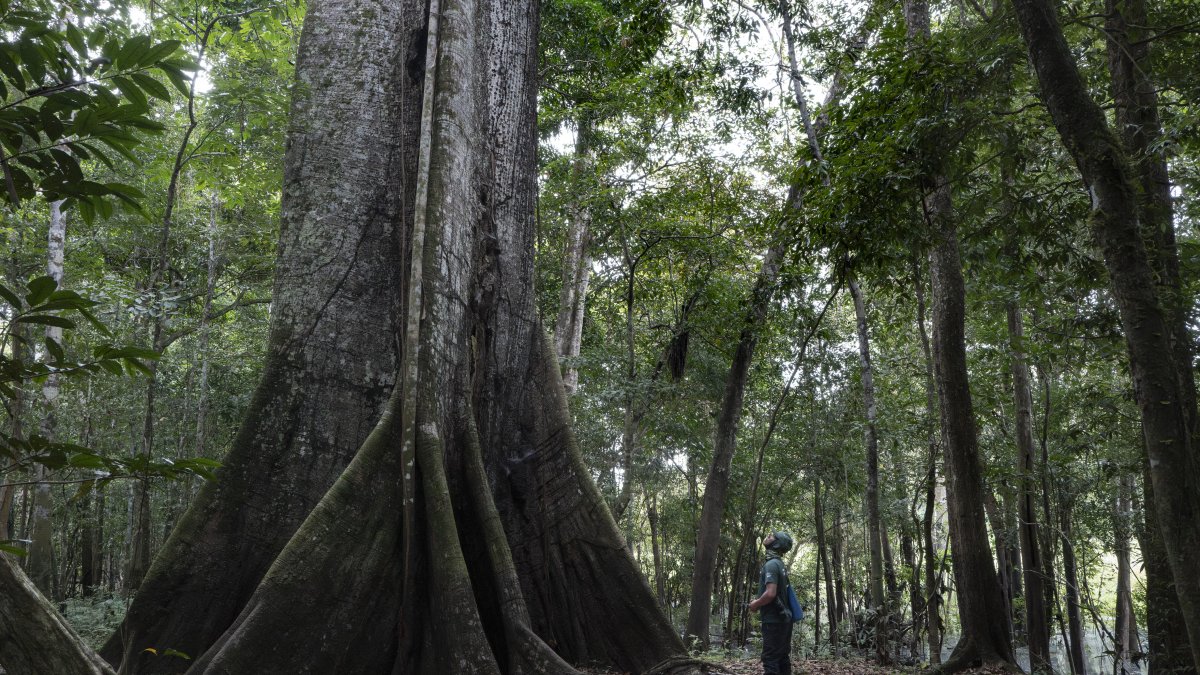
A ceiba tree in the Amazon rainforest.

The planet's vegetation has become more lush since the 1980s. However, this process, known as “greening,” has very different effects on water depending on the region. In some areas, it coincides with a reduction in water availability, and in others, with an increase.
This is the main conclusion of a study published in 2026 in the journal GIScience & Remote Sensing, by Taylor & Francis, which analyzes the relationship between vegetation growth, carbon and water on a global scale. The research combines satellite data with projections from ten climate models from the CMIP6 program for the period 2024–2100.
More vegetation, but less water during the historical period
The researchers used the leaf area index, known as LAI, to measure vegetation density. They also calculated water availability (W.A.) as the difference between precipitation and evapotranspiration—that is, the water that returns to the atmosphere from the soil and plants.
According to the study, LAI increased steadily between 1982 and 2023, with a significant increase in 69.71% of areas with vegetation. The increase was particularly noticeable in humid regions, which contributed most to global changes, and in forests, which showed the most intense greening among the major vegetation types.
Water availability, by contrast, followed a global downward trend during that same period. The study estimates that it decreased in 57.7% of areas with vegetation, although the decline was statistically significant in 14.31% of the analyzed area. Semi-arid regions experienced the fastest decline, with an average reduction of 0.51 millimeters per year.
Society
Two decades after 'An Inconvenient Truth': What does the data say about Al Gore's predictions?
Carlos Dominguez
Four patterns, not just two
The article identifies four spatial patterns based on the concurrent trends of LAI and W.A.:
- GAD (greening-associated drying): vegetation increases while water availability decreases. This pattern accounted for 48.6% of the study area over the historical period.
- GAW (greening-associated wetting): both vegetation and water availability increase. This pattern accounted for 34.6% of the area.
- BAW (browning-associated wetting): vegetation decreases while water increases. Only 7.7% of the area.
- BAD (browning-associated drying): both vegetation and water decrease. The remaining 9.2%.
The authors note that these categories describe a statistical correlation between vegetation and water trends. The study does not claim that greening is always the direct cause of a reduction or increase in water availability, as both processes may also be influenced by common climatic factors.
World
Heatwave in Europe: What is the 'Omega Block' and why isn’t It climate change’s fault?
Carlos Dominguez
The future could bring change
The climate projections analyzed by the researchers point to a change compared to the historical period. In future scenarios (2024–2100), global water availability associated with vegetated areas projects as a general upward trend.
In the high-emissions scenario (SSP5-8.5), the GAW pattern would cover 68.3% of the study area, and the GAD would lose the dominance it had during the historical period. Forests, which historically made negative contributions to W.A. trends due to their high transpiration rates, would begin to make positive contributions in future scenarios.
The study links this potential reversal to an increase in precipitation that exceeds the increase in evapotranspiration. In their projections, precipitation would increase at a rate of 1.22 millimeters per year, compared to an annual increase in evapotranspiration of 0.59 millimeters.
Temperature: The key factor
The research also examines the relationship between gross primary production (GPP) and water fluxes (E.T. and W.A.). Their results indicate that, although the spatial correlations between GPP and ET remain positive on a global scale, the strength of this coupling has steadily weakened over the past four decades, and this trend is likely to continue in the future.
In the case of GPP and W.A., 51.49% of the areas showed negative correlations during the historical period, reflecting a decoupling driven by evapotranspiration during greening.
Temperature emerges as the primary factor associated with this trend on a global scale, with contributions exceeding 55% in future scenarios. In arid and semiarid regions, vapor pressure deficit (VPD)—an indicator of air dryness—plays a greater role. In semi-humid areas, temperature, VPD and soil moisture act in concert. In humid regions, temperature is once again the dominant factor.
On an interannual scale, 72.06% of global regions exhibited precipitation-dominated characteristics, with relative contributions to the variance of W.A. exceeding 60%, a pattern that persists in future scenarios.
World
France | More than 7,300 excess deaths and 52 days of heat waves: Longest summer on record
Carlos Dominguez
Important limitations
Furthermore, the water availability indicator used by the authors is a climate balance (W.A. = P − E.T.) and does not directly include groundwater, runoff, soil storage or human consumption. The authors note that this approach is widely accepted at large spatial scales and annual time scales, but introduces uncertainties in regions with pronounced groundwater dynamics or intensive water management.
The study also uses averages from multiple datasets to increase robustness, but acknowledges that potential inconsistencies between products and systematic biases in the CMIP6 models—especially at high latitudes and in arid regions—may affect the accuracy of spatiotemporal patterns and future projections.
LATEST