


ANALYSIS
Trump 2017 vs. Trump 2025, in graphs
From record executive orders to immigration tightening and a drop in approval: four charts show how Trump's second first year differs from his first.

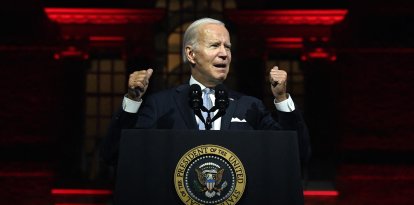
Trump in the White House

Donald Trump is months away from completing his second first year in the presidency. He began his 47th term with a 47% approval rating. After a 2025 full of ups and downs, his approval stood at 41% at the beginning of this December, according to a poll published by Reuters/Ipsos earlier Tuesday.
According to the pollster, this is due to a renewed focus on affordability. Trump was coming off a low since returning to the White House: 38% support. The December figure is a marked improvement from 2017, when he celebrated his first anniversary in the White House, then as the 45th president, with 36% support.
Here are four charts to compare Trump's first year during his first and second term:

One of the early differences between Trump 2025 and Trump 2017 was the speed of the executive orders. The pace was noticeable early: the president began signing orders on the same day as his inauguration. After 18 days, he had already signed 60, doubling the number from Joe Biden in the same period in 2021. He also far exceeded his own numbers during his first term.
That figure was taken as evidence that in his second term the Republican came to power better prepared than the first time. Before taking office, his team said they wanted to "hit the ground running." Another example is how long it took him to get the Senate to approve his nominees for the various government departments, such as Marco Rubio to the Department of State and Kristi Noem to the Department of Homeland Security. While in 2017 it took a total of 480 days to confirm all the picks, in 2025, this was reduced to 262 days, according to data from Ballotpedia.
One of the biggest focuses of Trump's second term is immigration. In this regard, his agenda has focused on shutting down the flow of border entries (measured in "encounters" with border authorities) and increasing deportations. According to his administration, more than 2 million illegal immigrants have left the country, including more than 1.6 million who have voluntarily self-deported and more than 527,000 forced deportations.
The immigration figures for Trump's first few years fall between different fiscal years. Fiscal year 2017 (October 2016 to September 2017) includes almost all but three months of his first anniversary, and the same is true for fiscal year 2025.

Voters' concern about the economy was one of the reasons that got Trump into the White House twice. Although it is too early to know the annual economic data for this year (the table below was made from estimates), the administration remains optimistic.
Treasury Secretary Scott Bessent maintained in a recent interview that GDP is projected to grow by 3%. "We've had GDP growth of 4% in a couple of quarters. We're going to end the year, despite the confinement imposed by Schumer, with real GDP growth of 3%," he assured CBS News' "Face The Nation."
LATEST