Traffic hell: the five worst cities to drive in
A ranking called the "Traffic Index" measures the average time it takes a vehicle to travel a distance of six miles. In 2022, a driver lost more than 50 hours in traffic congestion.

Voz Media (Pxfuel - Wikimedia Commons)
A report by TomTom, a company that manufactures navigation systems for vehicles and phones, revealed the worst cities in the country to drive in. They all have one thing in common: they are led by Democratic mayors. This is a fact.
The company annually publishes a "Traffic Index" ranking. It measures traffic (in 390 cities in 56 countries around the world) based on the average time it takes a driver to travel six miles.
The five cities with the worst traffic in the U.S.
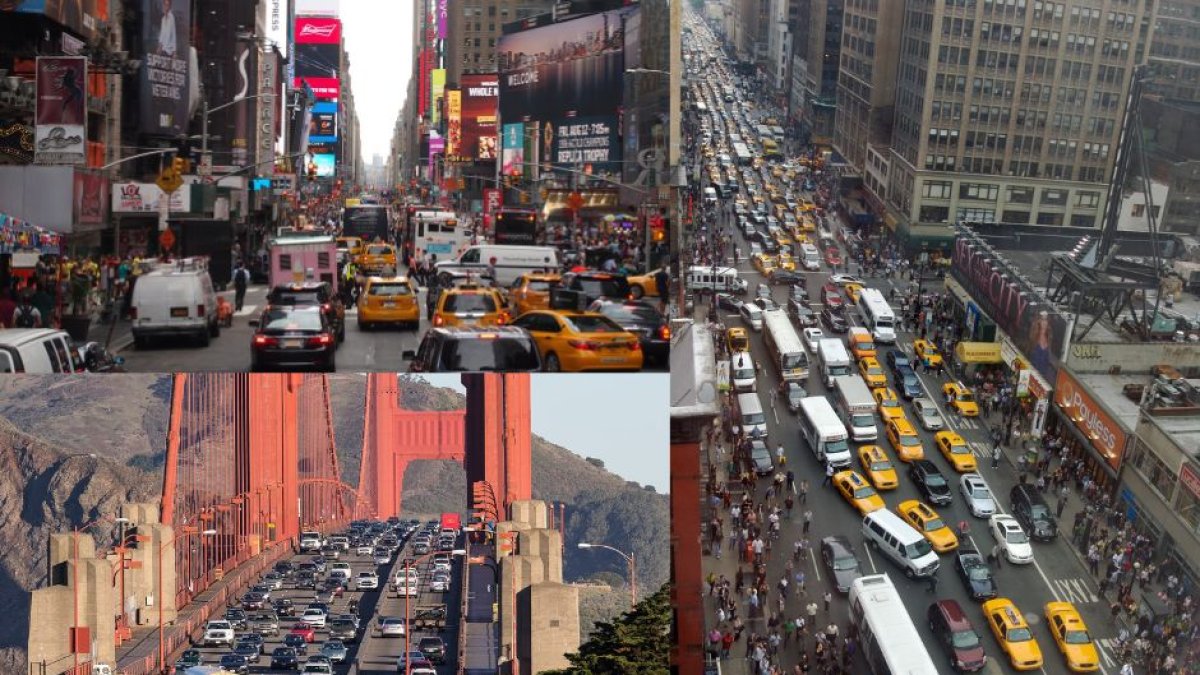
In 2022, driving through almost any major city took longer. New York, Washington, D.C. San Francisco, Boston and Chicago topped the 2022 list of the worst cities to drive in the entire nation for slow traffic:
- New York #1: The Big Apple led the national ranking with an average travel time of nearly 25 minutes over a distance of six miles. Globally, NYC ranked 19th in the rankings. Compared to the estimated travel time in 2021, each New York driver added just over a minute to last year's time.
- Washington D.C. #2: The country's capital came in second in the national rankings with an average travel time of almost 21 minutes over a distance of six miles. Globally, D.C. ranked 54th on the list. Compared to the estimated travel time in 2021, each driver in the capital added an extra minute and a half to their travel time.
- San Francisco #3: The city known to its residents as The City ranked third nationally with an average travel time of nearly 21 minutes. It came in 58th globally. The duration of each trip increased by almost a minute compared to 2021.
- Boston #4: With an average travel time of nearly 19 minutes, the capital and largest city in Massachusetts took fourth place in the nationwide rankings. Among the 390 cities in the ranking, Boston ranks 83rd. Each driver increased their trip time by one minute and ten seconds compared to the 2021 estimate.
- Chicago #5: The Windy City, with an average travel time of 17 minutes, ranked fifth on the national list. Globally, Chicago ranked 95th. If you compare the time of each six-mile trip in 2022 with the 2021 estimate, the time went up by 40 seconds.
The cities with the worst traffic are all governed by Democrats
Many factors can influence the increase of traffic in a city. However, some obstructions on the road are the result of ongoing activism and protest efforts. Simply put, local authorities' poor organization and decisions to do construction and repair work at peak hours leads to more traffic.
Last year, the average driver spent more than 50 hours in traffic jams, 15 hours more than in 2021. The average extra expense per driver in the U.S. was almost $900, just for the increase in travel time (this figure does not include increases in fuel prices).
The report also stated that traffic decreased due to the pandemic in 2020 and 2021. When people started going back into the office in 2022, this caused more traffic in the cities analyzed in the report.


